The Fund is alternative in nature and a complement to equities in a diversified portfolio:
- Targets lower portfolio risk and volatility compared to broader equity markets
- Historically proven to exhibit low beta or correlation to the ASX200 and other market indices
- Employs a conservative, disciplined, and opportunistic investment process
- Risk weighted position sizing aligned to capital preservation (manage downside risk, not index risk)
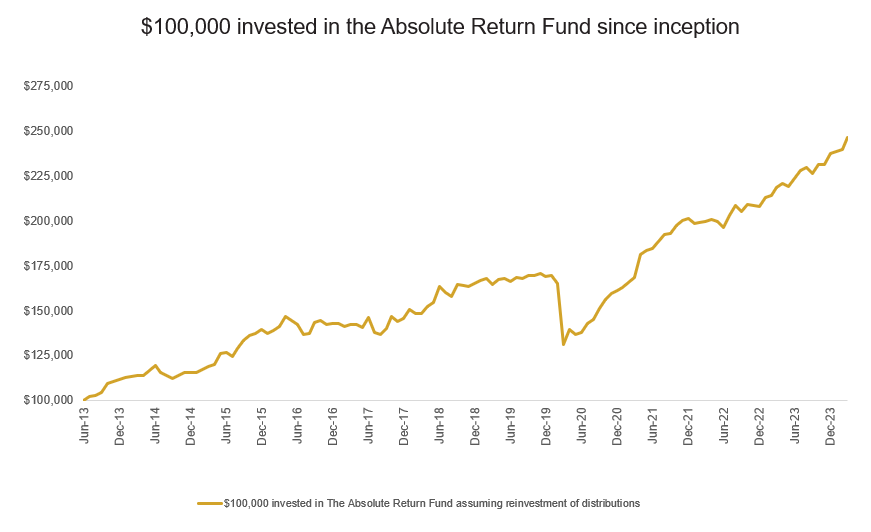
PERFORMANCE SUMMARY
As at 31 March 2024 | Inception date: 1 July 2013
1 Month | 3 Months | Financial Year to Date | 1 Year | Annualised Return (since inception p.a) |
|
Absolute Return Fund | 2.68% | 3.74% | 10.22% | 12.65% | 8.75% |
Benchmark (RBA Cash Rate) | 0.36% | 1.09% | 3.22% | 4.14% | 1.78% |
Excess Return | 2.32% | 2.65% | 7.00% | 8.51% | 6.97% |
* Past performance is no indication of future performance. Investments may rise and fall in value and returns cannot be guaranteed. Returns are based on the mid-point of unit prices and are net of all fees and charges. Unless otherwise stated, all figures are in Australian dollars and include GST.
RECENT REPORTS
JUL | AUG | SEP | OCT | NOV | DEC | JAN | FEB | MAR | APR | MAY | JUN | FYTD |
|
FY14 | 2.10% | 0.70% | 1.78% | 4.51% | 1.02% | 1.05% | 0.80% | 0.45% | 0.73% | 0.11% | 2.20% | 2.43% | 19.34% |
FY15 | -3.18% | -1.26% | 1.61% | 1.31% | 1.35% | 0.18% | -0.02% | 1.36% | 1.62% | 1.05% | 4.82% | 0.45% | 6.01% |
FY16 | -1.53% | 3.67% | 3.32% | 2.01% | 0.90% | 1.71% | -1.78% | 1.34% | 1.45% | 3.94% | -1.51% | -1.30% | 12.65% |
FY17 | -3.91% | 0.31% | 4.33% | 0.81% | -1.40% | 0.34% | 0.00% | -1.29% | 0.91% | -0.06% | -1.26% | 4.10% | 2.63% |
FY18 | -5.84% | -0.66% | 2.47% | 4.56% | -1.90% | 1.45% | 3.41% | -1.52% | -0.16% | 2.52% | 1.52% | 5.78% | 11.65% |
FY19 | -2.13% | -1.16% | 4.08% | -0.11% | -0.62% | 1.27% | 0.80% | 0.81% | -2.01% | 1.65% | 0.34% | -1.03% | 1.73% |
FY20 | 1.23% | -0.17% | 1.10% | -0.15% | 0.61% | -0.94% | 0.27% | -2.42% | -20.52% | 6.37% | -2.02% | 0.50% | -17.19% |
FY21 | 3.75% | 1.66% | 4.06% | 3.61% | 1.94% | 1.18% | 1.10% | 1.46% | 1.73% | 7.83% | 1.23% | 0.34% | 34.04% |
FY22 | 2.11% | 2.27% | 0.33% | 2.13% | 1.39% | 0.76% | -1.40% | 0.12% | 0.42% | 0.57% | -0.55% | -1.74% | 6.50% |
FY23 | 3.31% | 2.69% | -1.38% | 1.76% | -0.13% | -0.30% | 2.36% | 0.41% | 2.21% | 0.93% | -0.71% | 2.00% | 13.81% |
FY24 | 2.00% | 0.76% | -1.40% | 2.11% | 0.13% | 2.55% | 0.49% | 0.53% | 2.68% | 10.22% |
* Past performance is no indication of future performance. Investments may rise and fall in value and returns cannot be guaranteed. Returns are based on the mid-point of unit prices and are net of all fees and charges.